IstoVisio (syGlass) inc.
Redesigning the K-12 Dashboard to Reduce Support Requests
Project:
Dashboard (Web) | Education
My role:
Lead Product Designer
Team:
UX Consultant
Lead Engineer
Front-end Engineer
Timeline:
May 2024 - August 2024
Product
syGlass offers immersive (VR) lectures for K-12 students, helping them learn subjects like cell biology, neuroscience, and psychology in a more engaging way. It’s currently used in 10 schools, supporting 500+ students.
Problem
syGlass serves 2 main user groups, each with distinct challenges:
Teachers:
Lack of visibility into students' progress while they watch lectures in VR.
Struggle with navigating the dashboard due to a non-intuitive interface.
Students:
Frequently forget their passwords, making it difficult to log in to VR classrooms.
Bussiness goal
Reduce the time syGlass teams spend addressing UI-related questions and recovering student accounts.
Old & New Dashboard design
Redesign Timeline & Process
We began the redesign in early June 2024, aiming to complete it by mid-August 2024, in time for the Fall semester, and structured the project with the following schedule:
Evaluation of current workflow
I led a meeting with the engineering team to review workflows and identify technical improvements that would enhance efficiency and user experience while staying on track with the project timeline.
Key decisions included:
Combine Two Websites into One: Simplify user registration and login, eliminating the need for engineers to manually add users and assign roles.
Tailored User Versions: Create separate dashboards for students and teachers, removing irrelevant features for each group.
"Create Class" Feature: Empower teachers to set up classes independently, reducing engineering involvement and giving teachers more control.
Research
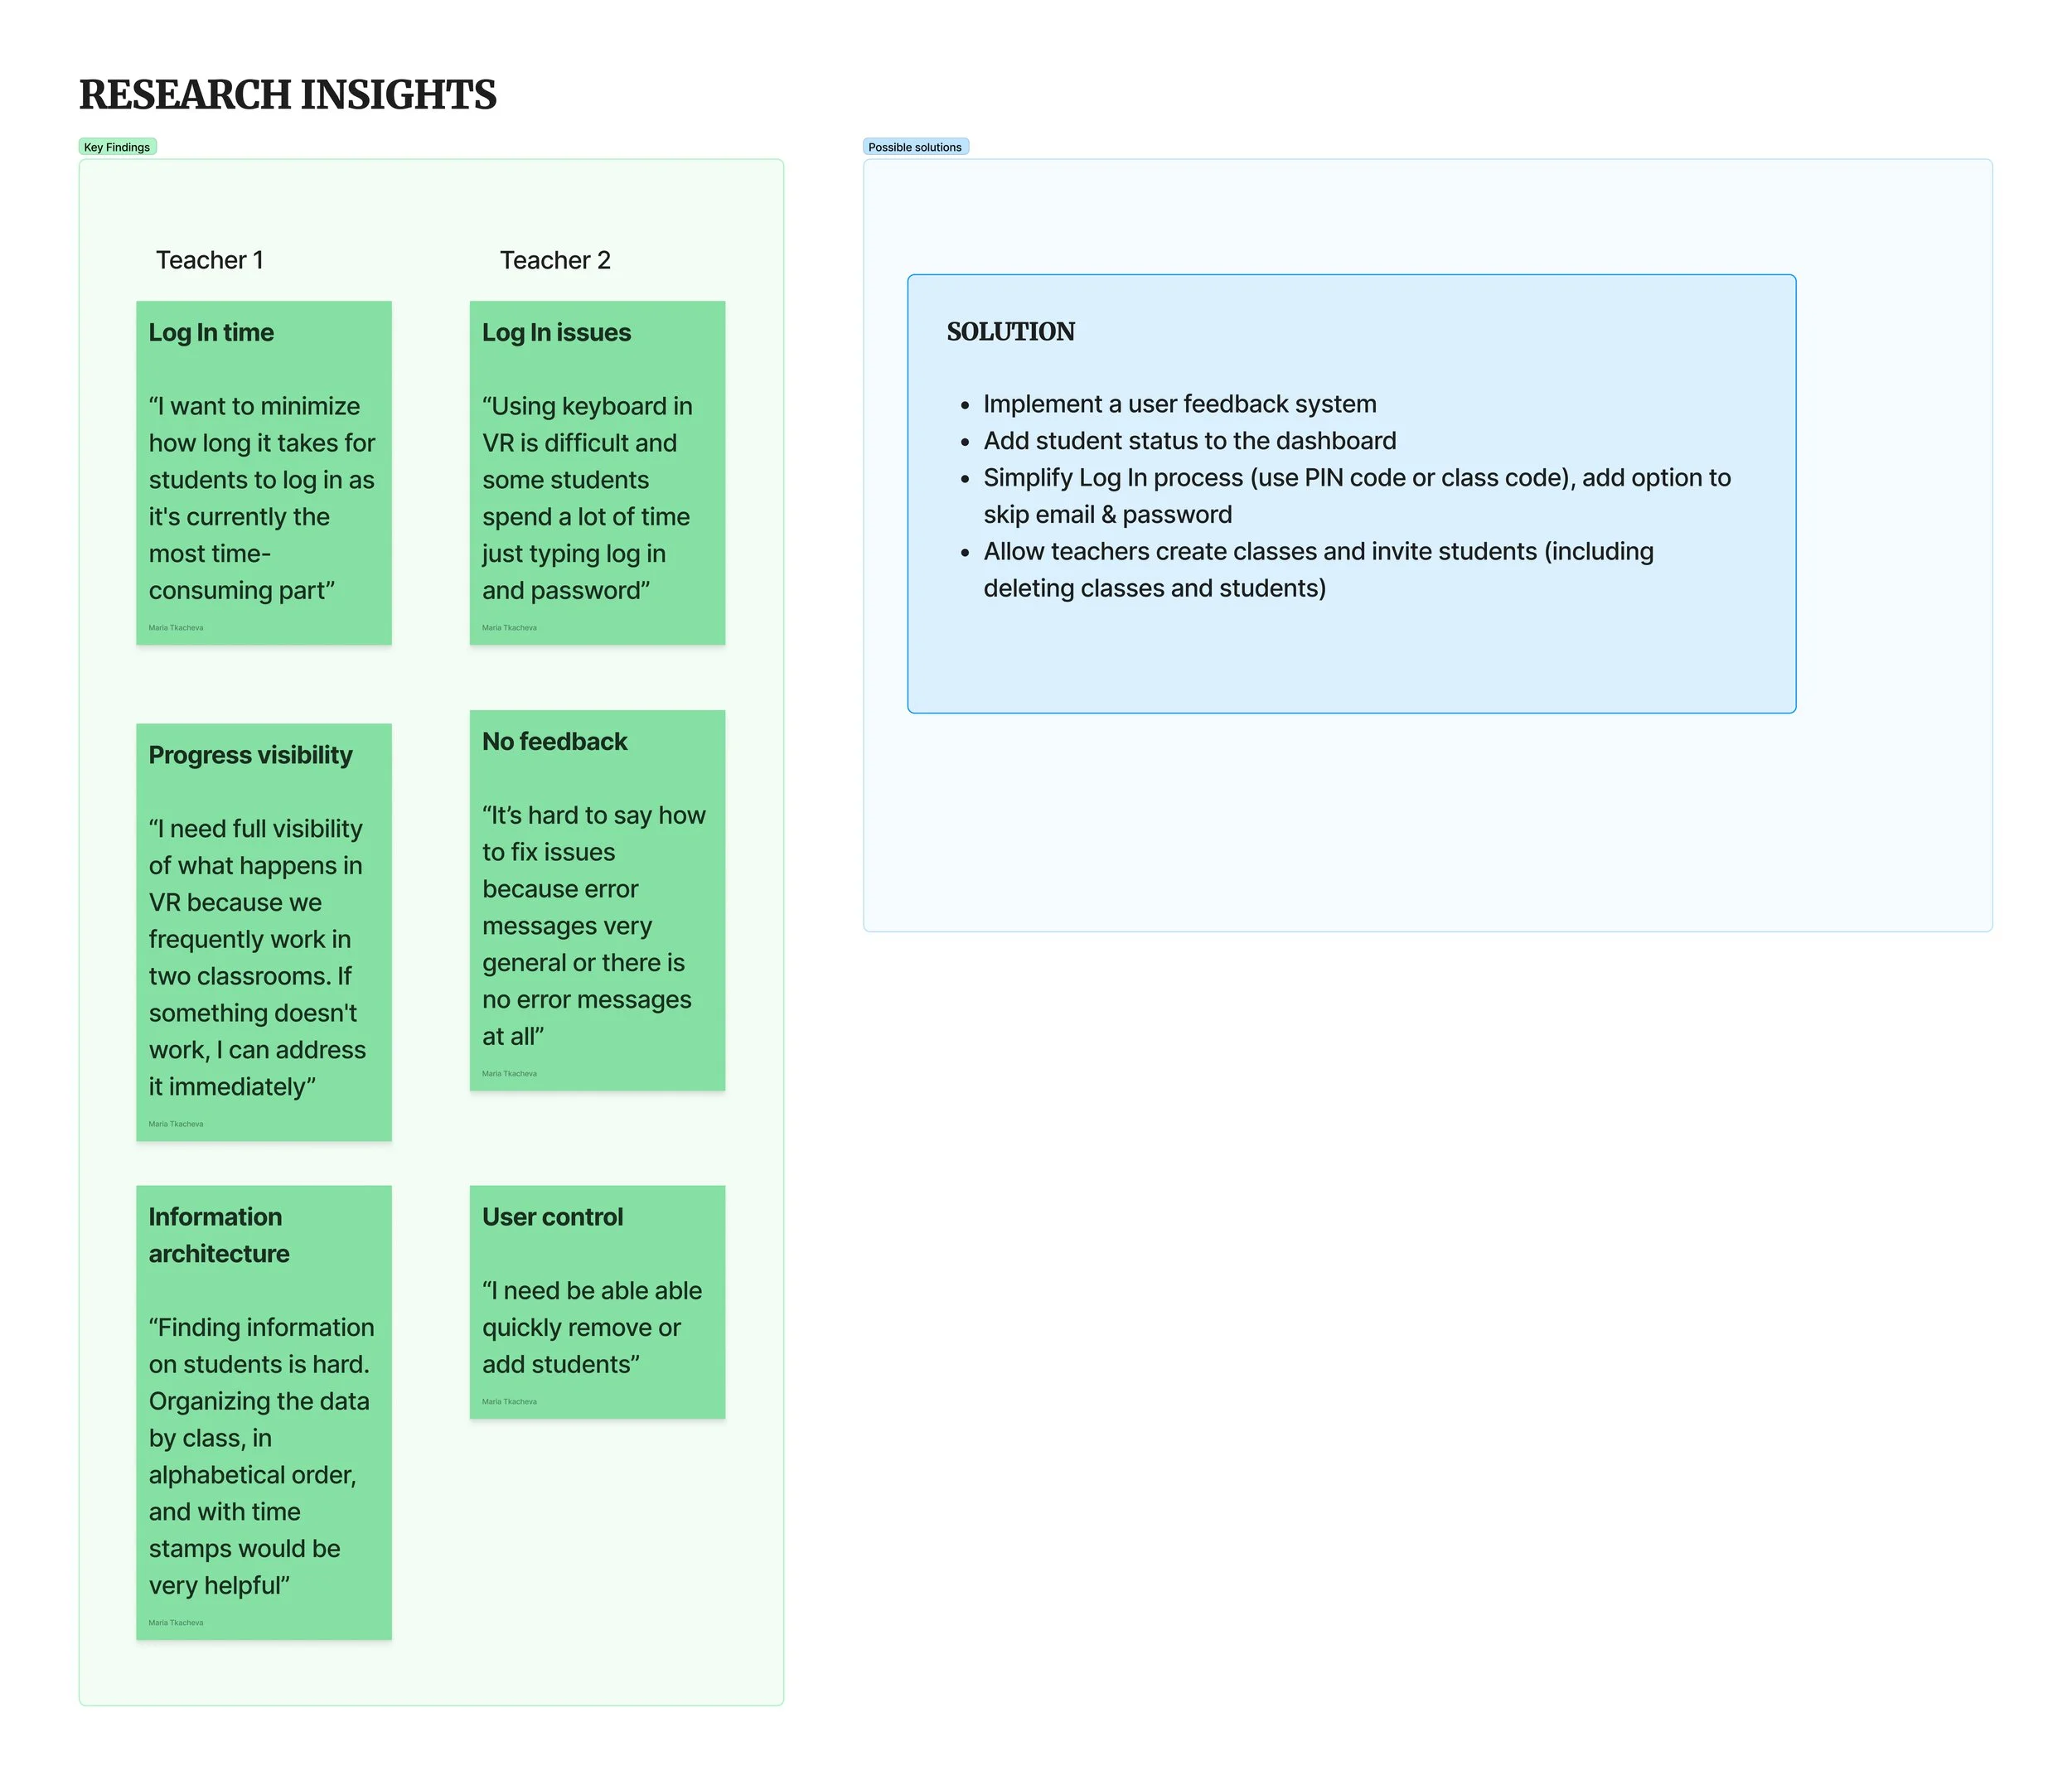
For research, I chose interviews to gather in-depth insights into user problems and goals. Despite the challenge of finding teachers during the summer break, I secured interviews with two teachers and gained the following insights:
Mapping Insights to Enhance the Dashboard
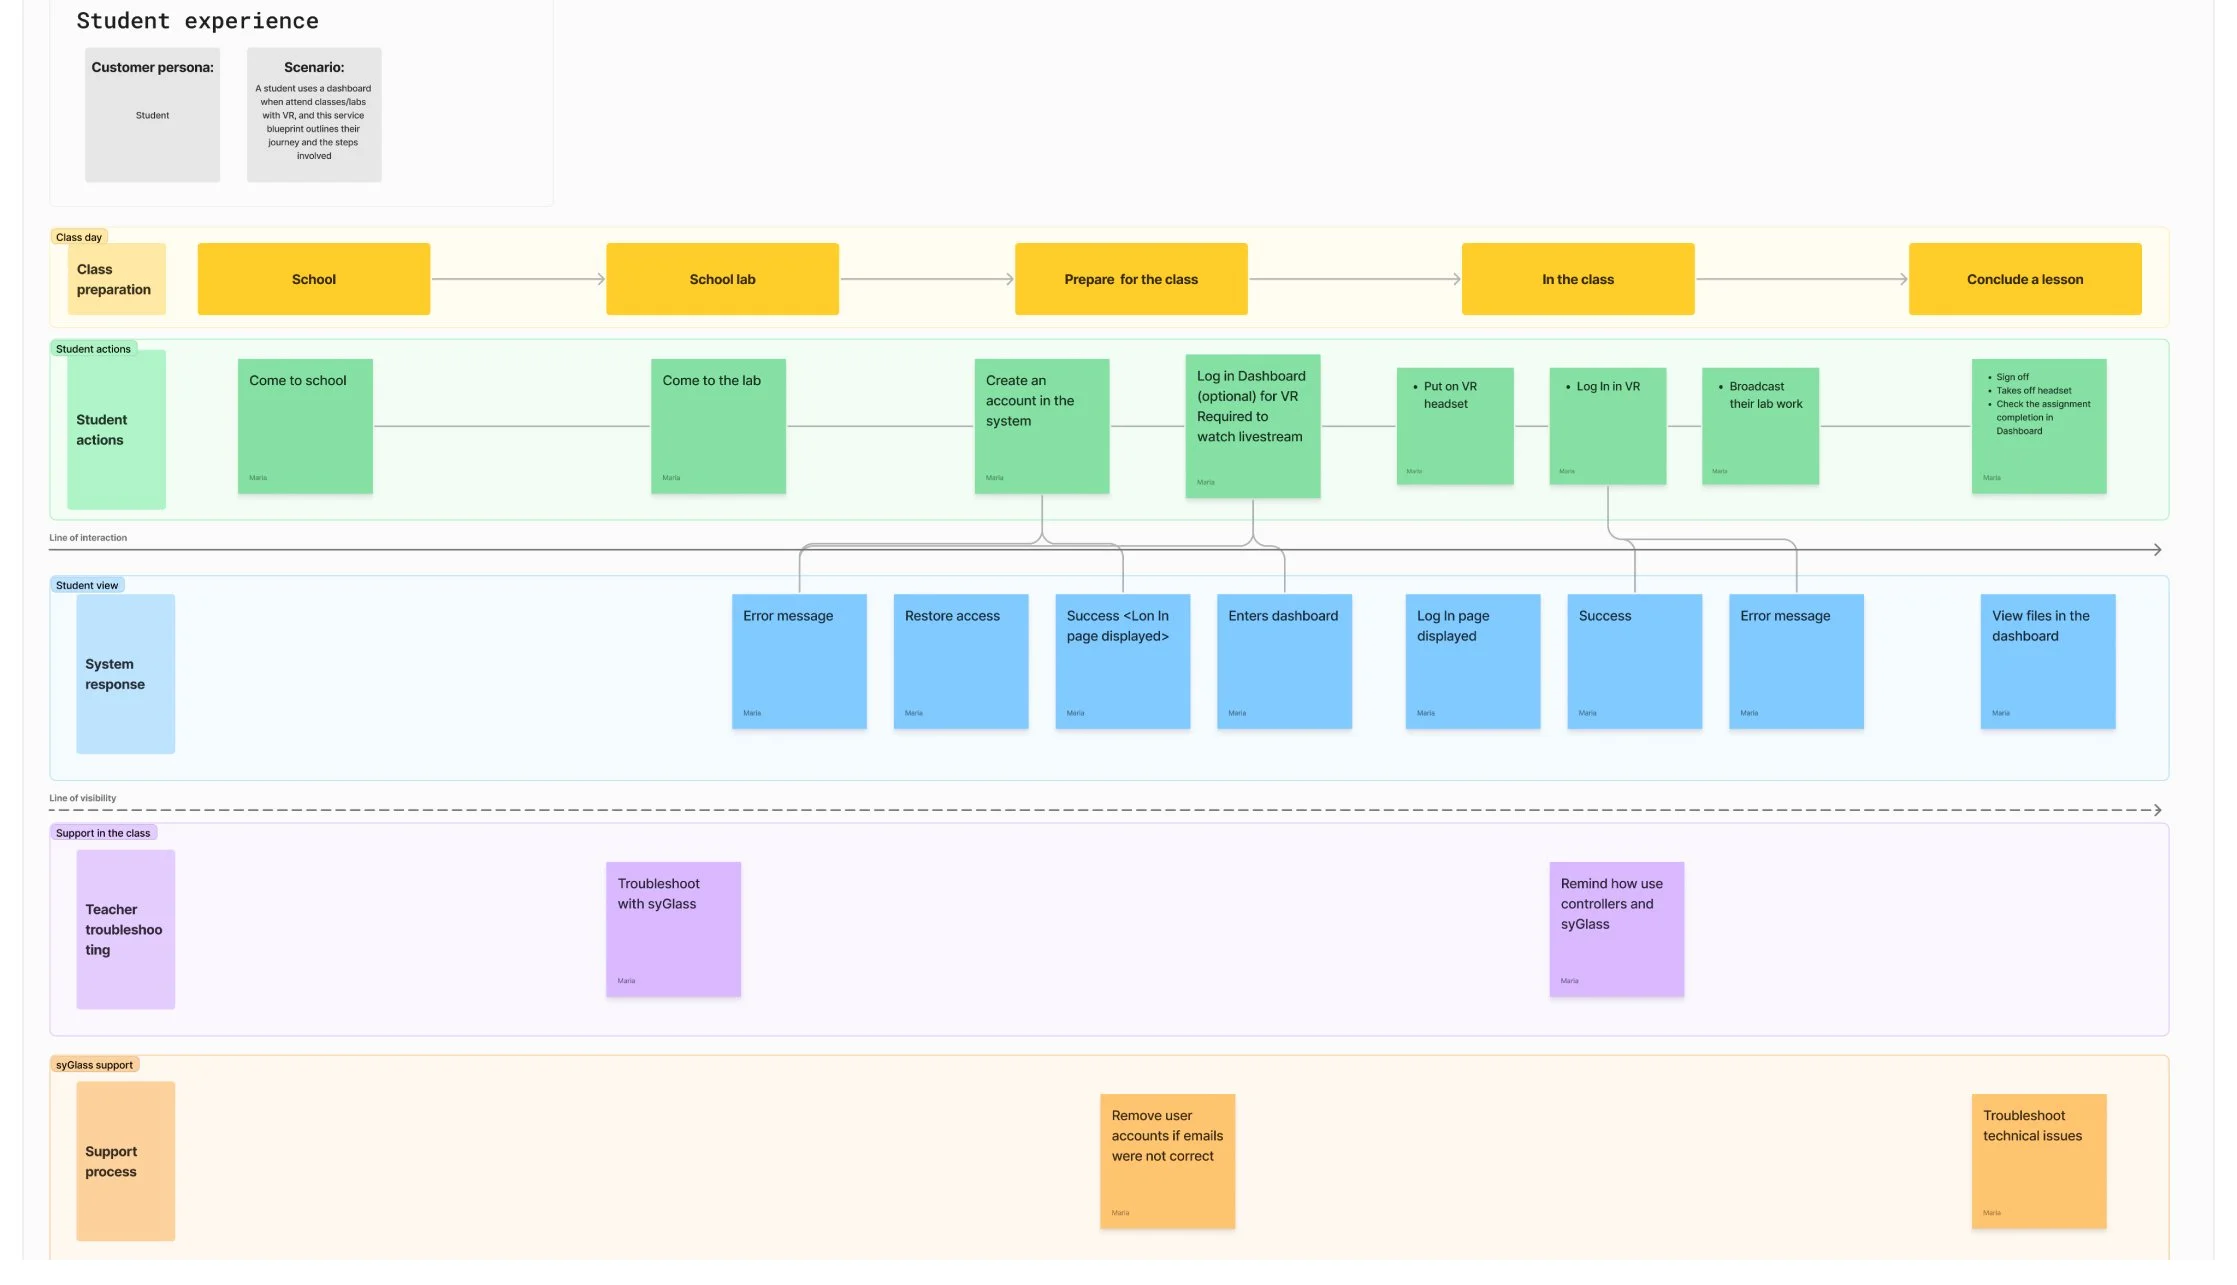
By evaluating the current workflow and conducting teacher interviews, we gained valuable insights into their needs and challenges. To share these findings with the team, I created service blueprints that mapped out workflows for both teachers and students. These blueprints highlighted key goals from the “Evaluation of Current Workflow” meeting and identified new objectives for the next dashboard update to make the education process smoother.
Next Steps:
Add interactive tutorials to help students learn controllers independently, saving teachers time.
Introduce a streaming option for multiple laptops to support better group collaboration.
Design
Due to time constraints and teachers being on break, I couldn’t conduct usability testing. Instead, I handed off the final designs to the engineering team, conducted internal testing, and launched the updated dashboard.
Key elements shaping the solution:
Streamlined Account Creation and Login
Created an easier account setup and login process, removing the need for engineers to assign roles manually. This saved the team time and allowed them to focus on other important projects.
Easier and Faster Login
We introduced a 4-digit PIN code for logging into the VR classroom, automatically generated in the student dashboard. This replaced the tedious process of entering an email and password on a VR keyboard. To ensure flexibility, we also retained the original login option, giving users multiple ways to access classrooms.
Teacher-Controlled Class Creation
Previously, teachers relied heavily on the syGlass engineering team to set up classes and invite students, which was time-consuming and inefficient. To address this, I designed a solution that allows teachers to create classes and invite students independently, giving them more control and streamlining the workflow.
System Status Visibility and Enhanced File Organization
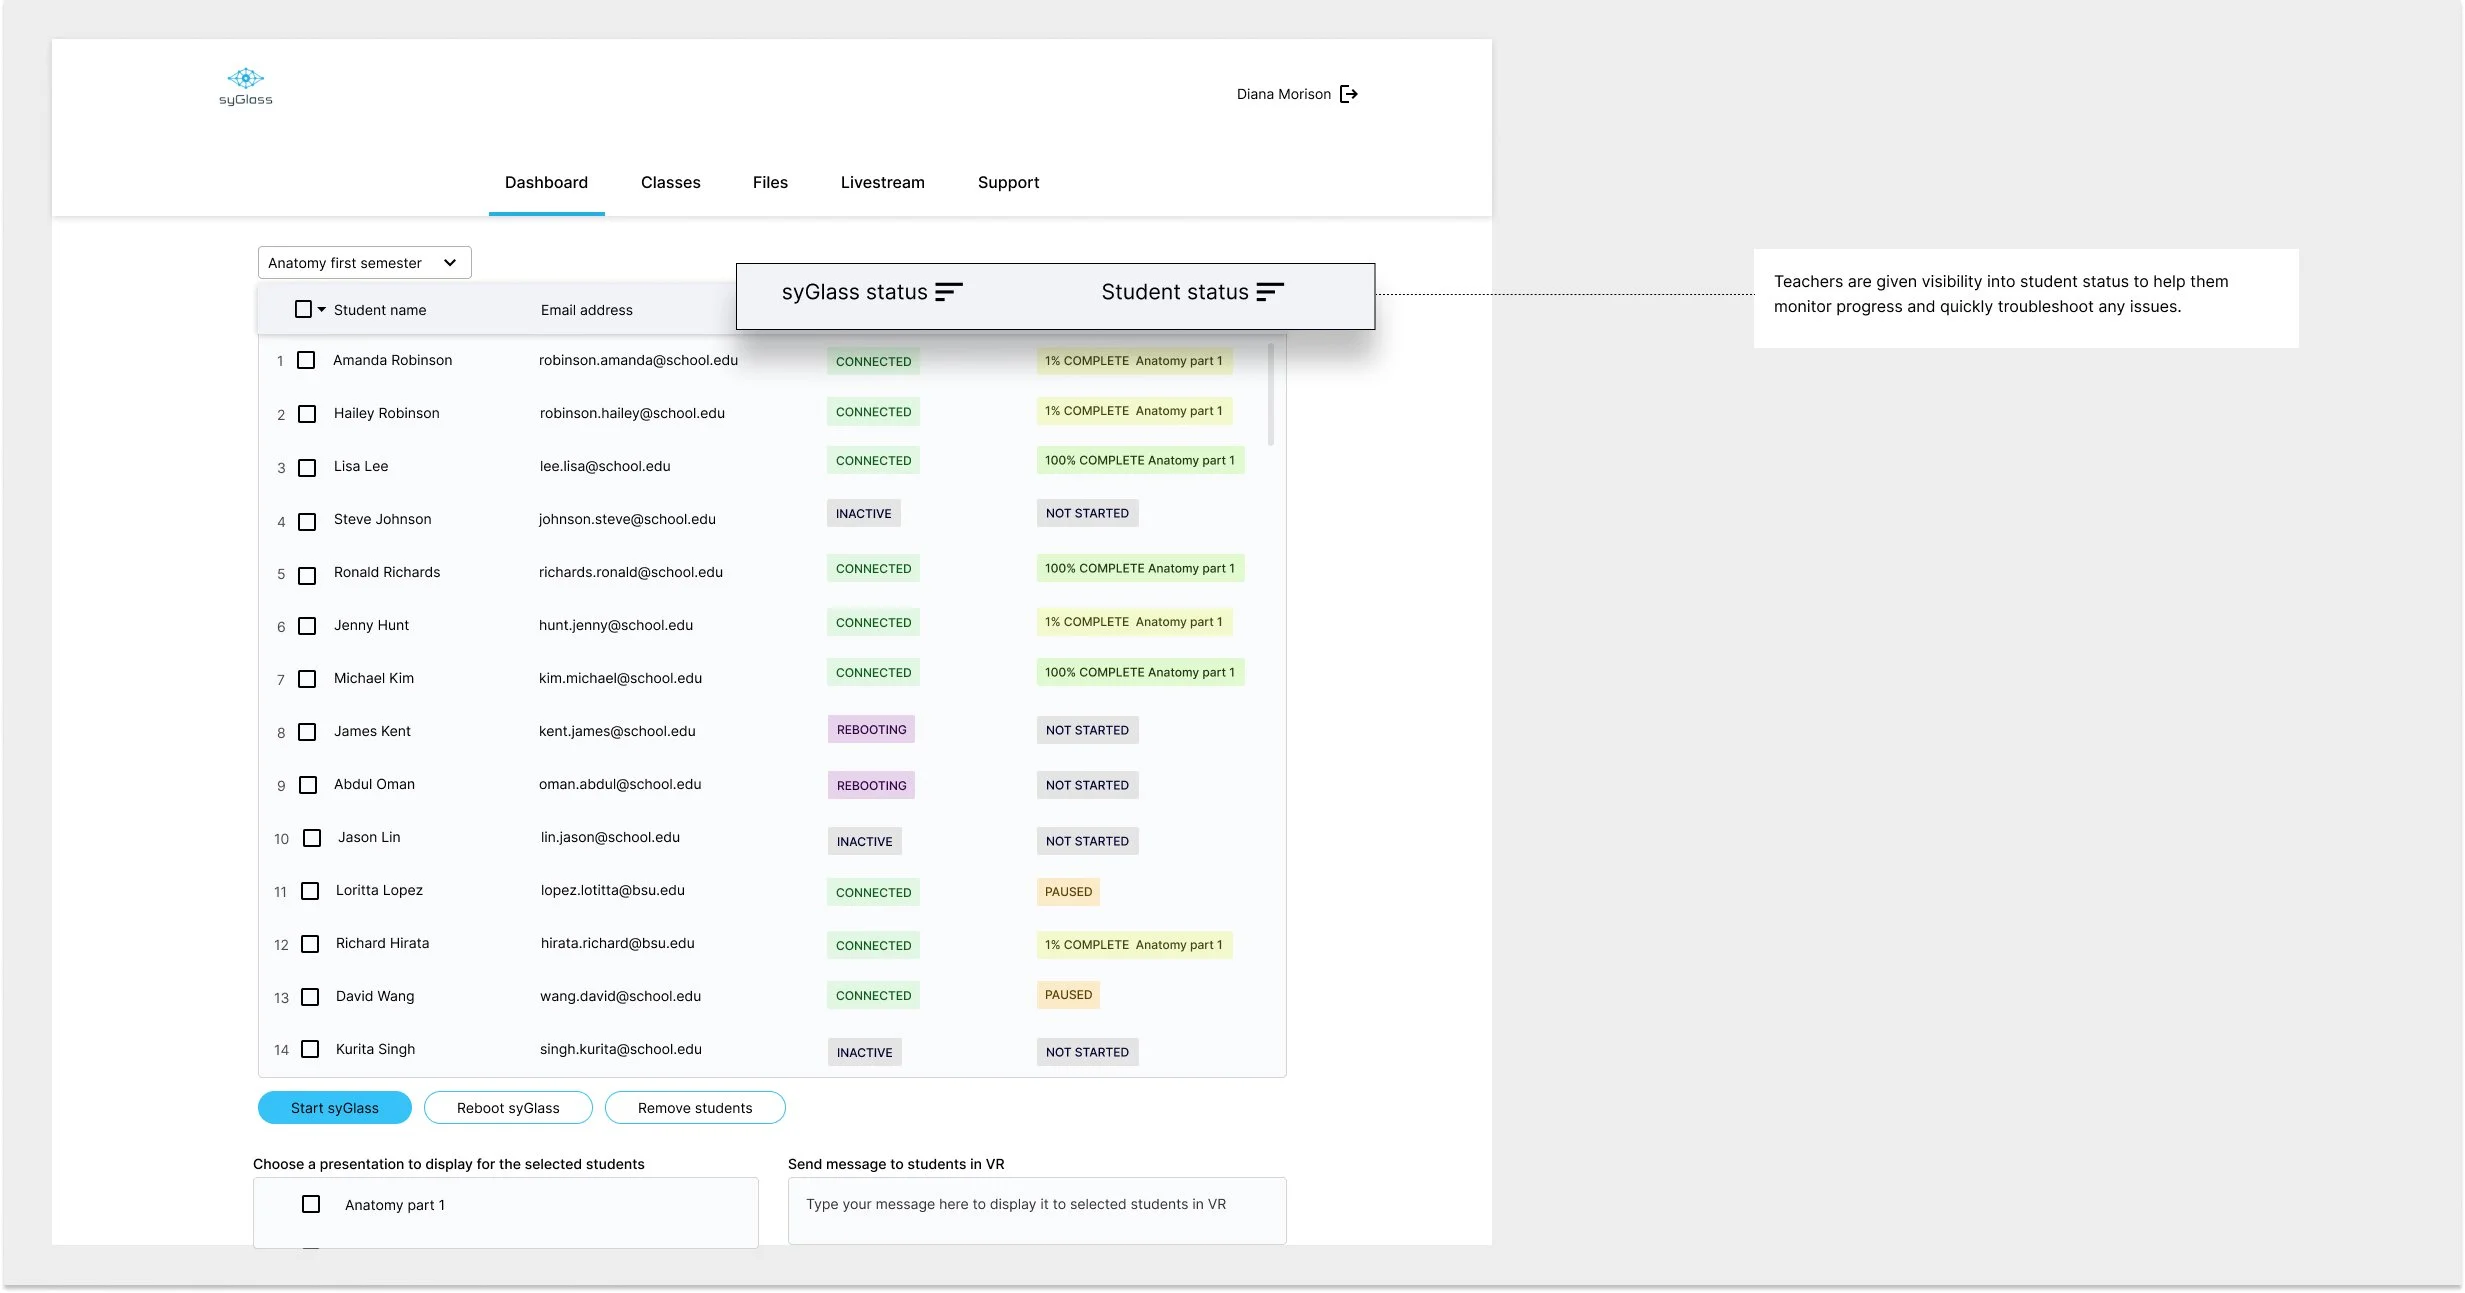
Teachers can now monitor students in real time, seeing whether they are in VR classrooms and tracking their progress. Additionally, improved file organization enables teachers to quickly locate and sort files, significantly boosting efficiency.
60% reduction in UI-related support requests
Impact
The dashboard was launched in mid-August 2024, achieving the following results:
95% drop in user errors related to the student login
75% reduction in engineering support time


